Side-by-side, with the numbers that matter.
Two rigs, one table. Higher numbers win in cobalt; TDP and price flip.
Rig A
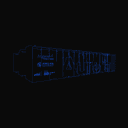
Aurora
Intel / HPE · workstation
Change
- 1X Neo
- Agility Robotics Digit
- Alibaba Qwen2.5-72B-Instruct (Q4 quant)
- AMD Instinct MI300X
- AMD Instinct MI325X
- AMD Instinct MI355X
- Anthropic Claude Opus 4.7
- Apple Mac Pro (M2 Ultra, 2023)
- Apple Mac Studio (M3 Ultra)
- Apple MacBook Pro 16-inch, M4 Max (2024)
- Apptronik Apollo
- Aurora
- AWS Trainium2
- Boston Dynamics Atlas
- Boston Dynamics Spot
- Cerebras Wafer-Scale Engine 3
- El Capitan
- Figure 02
- Frontier (OLCF-5)
- Google Cloud TPU v5p
- Groq Language Processing Unit
- Intel Gaudi 3 HL-325L
- MSI GeForce RTX 5090 Suprim Liquid
- NVIDIA B100
- NVIDIA B200
- NVIDIA DGX B200
- NVIDIA DGX H200
- NVIDIA DGX Spark
- NVIDIA Eos DGX SuperPOD
- NVIDIA GB200
- NVIDIA GB200 NVL72
- NVIDIA GeForce RTX 4090 Founders Edition
- NVIDIA GeForce RTX 5070 Ti
- NVIDIA GeForce RTX 5080 Founders Edition
- NVIDIA GeForce RTX 5090 Founders Edition
- NVIDIA GH200 Grace Hopper
- NVIDIA H100
- NVIDIA H200
- NVIDIA HGX B200
- NVIDIA Jetson AGX Thor
- NVIDIA RTX PRO 4500 Blackwell
- NVIDIA RTX PRO 5000 Blackwell
- NVIDIA RTX PRO 6000 Blackwell
- OpenAI GPT-5
- SambaNova SN40L Reconfigurable Dataflow Unit
- Sanctuary AI Phoenix
- Tesla Optimus
- The Stargate Project
- Unitree B2
- Unitree G1
- Unitree H1
Rig B
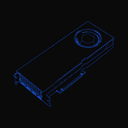
NVIDIA RTX PRO 5000 Blackwell
NVIDIA · workstation
Change
- 1X Neo
- Agility Robotics Digit
- Alibaba Qwen2.5-72B-Instruct (Q4 quant)
- AMD Instinct MI300X
- AMD Instinct MI325X
- AMD Instinct MI355X
- Anthropic Claude Opus 4.7
- Apple Mac Pro (M2 Ultra, 2023)
- Apple Mac Studio (M3 Ultra)
- Apple MacBook Pro 16-inch, M4 Max (2024)
- Apptronik Apollo
- Aurora
- AWS Trainium2
- Boston Dynamics Atlas
- Boston Dynamics Spot
- Cerebras Wafer-Scale Engine 3
- El Capitan
- Figure 02
- Frontier (OLCF-5)
- Google Cloud TPU v5p
- Groq Language Processing Unit
- Intel Gaudi 3 HL-325L
- MSI GeForce RTX 5090 Suprim Liquid
- NVIDIA B100
- NVIDIA B200
- NVIDIA DGX B200
- NVIDIA DGX H200
- NVIDIA DGX Spark
- NVIDIA Eos DGX SuperPOD
- NVIDIA GB200
- NVIDIA GB200 NVL72
- NVIDIA GeForce RTX 4090 Founders Edition
- NVIDIA GeForce RTX 5070 Ti
- NVIDIA GeForce RTX 5080 Founders Edition
- NVIDIA GeForce RTX 5090 Founders Edition
- NVIDIA GH200 Grace Hopper
- NVIDIA H100
- NVIDIA H200
- NVIDIA HGX B200
- NVIDIA Jetson AGX Thor
- NVIDIA RTX PRO 4500 Blackwell
- NVIDIA RTX PRO 5000 Blackwell
- NVIDIA RTX PRO 6000 Blackwell
- OpenAI GPT-5
- SambaNova SN40L Reconfigurable Dataflow Unit
- Sanctuary AI Phoenix
- Tesla Optimus
- The Stargate Project
- Unitree B2
- Unitree G1
- Unitree H1
0 of 36 fields comparable
⇄ swap sides| Spec | Aurora | NVIDIA RTX PRO 5000 Blackwell |
|---|---|---|
| Accelerator | Intel Data Center GPU Max | — |
| AI Tops | — | 2,064 |
| Architecture | HPE Cray EX with Intel Exascale Compute Blade | — |
| Bandwidth GB S | — | 1,344 |
| Cores | 9,264,128 | — |
| CPU | Intel Xeon CPU Max 9470 52C 2.4GHz | — |
| Cuda Cores | — | 14,080 |
| Displayport Count | — | 4 |
| Displayport Version | — | 2.1 |
| ECC | — | true |
| Form factor | — | 4.4 in H x 10.5 in L, dual slot |
| FP32 TFLOPS | — | 65 |
| Installation Year | 2,023 | — |
| Interconnect | HPE Slingshot-11 | — |
| Location | DOE/SC/Argonne National Laboratory | — |
| Manufacturer | Intel / HPE | — |
| Nvdec Count | — | 3 |
| Nvdec GEN | — | 6 |
| Nvenc Count | — | 3 |
| Nvenc GEN | — | 9 |
| Pcie GEN | — | 5 |
| Power KW | 38,698.36 | — |
| Rmax Pflops | 1,012 | — |
| Rpeak Pflops | 1,980.01 | — |
| RT Cores | — | 110 |
| RT Cores GEN | — | 4 |
| RT Tflops | — | 196 |
| Slot Width | — | 2 |
| TDP (W)↓ better | — | 300 |
| Tensor Cores | — | 440 |
| Tensor Cores GEN | — | 5 |
| Top500 Rank Jun2026 | 4 | — |
| Top500 Rank Nov2025 | 3 | — |
| VRAM (GB) | — | 48 |
| Vram GB ALT | — | 72 |
| Vram Type | — | GDDR7 ECC |